Class: secrets | Unit: Unknown | Updated: 2026-02-09
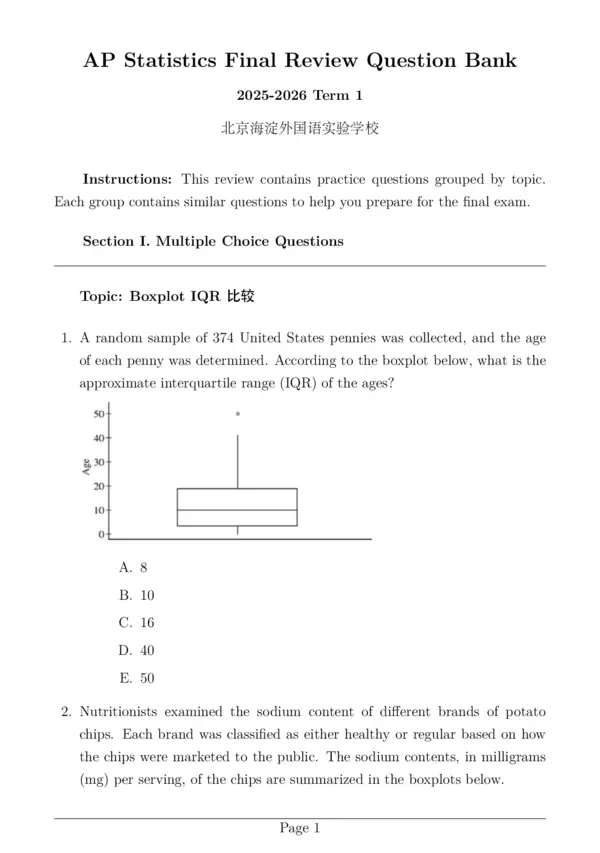
AP Statistics Final Review Question Bank 2025-2026 Term 1 北京海淀外国语实验学校 Instructions: This review contains practice questions grouped by topic. Each group contains similar questions to help you prepare for the final exam. Section I. Multiple Choice Questions Topic: Boxplot IQR 比较 1. A random sample of 374 United States pennies was collected, and the age of each penny was determined. According to the boxplot below, what is the approximate interquartile range (IQR) of the ages? Age 50+ 40+ 30- * 20 10+ 0 A. 8 B. 10 C. 16 D. 40 Ε. 50 2. Nutritionists examined the sodium content of different brands of potato chips. Each brand was classified as either healthy or regular based on how the chips were marketed to the public. The sodium contents, in milligrams (mg) per serving, of the chips are summarized in the boxplots below. Regular Chips Healthy Chips 75 100 125 150 175 200 225 250 275 300 Sodium Content (mg) Based on the boxplots, which statement gives a correct comparison between the two classifications of the sodium content of the chips? A. The number of brands classified as healthy is greater than the number of brands classified as regular. B. The interquartile range (IQR) of the brands classified as healthy is greater than the IQR of the brands classified as regular. C. The range of the brands classified as healthy is less than the range of the brands classified as regular. D. The median of the brands classified as healthy is more than twice the median of the brands classified as regular. E. The brand with the least sodium content and the brand with the greatest sodium content are both classified as healthy. Height (centimeters) 250- 200- 150 100- 50- 中中 ** 0 Fertilized * Unfertilized The figure above summarizes the heights, in centimeters, of approximately 400 pine seedlings six years after they were planted at a center for environ- mental study. Approximately half of the trees were fertilized yearly, and the remaining trees were never fertilized. Which of the following statements about the medians and interquartile ranges (IQRs) of the heights of the two groups of trees 6 years after being planted is true? A. The medians and IQRs are the same for the unfertilized trees and the fertilized trees. B. The median for the unfertilized trees is greater than the median for the fertilized trees, and the IQR is also greater for the unfertilized trees. C. The median for the unfertilized trees is the same as the median for the fertilized trees, and the IQR is greater for the unfertilized trees. D. The median for the unfertilized trees is less than the median for the fertilized trees, and the IQR is greater for the unfertilized trees. E. The median for the unfertilized trees is less than the median for the fertilized trees, and the IQR is less for the unfertilized trees. 3. An airline recorded the number of on-time arrivals for a sample of 100 flights each day. The boxplot below summarizes the recorded data for one year. 70 80 90 Number of On-Time Arrivals 100 Based on the boxplot, which of the following statements must be true? A. The range of the number of on-time arrivals is greater than 90. B. The interquartile range of the number of on-time arrivals is 22. C. The number of days that had at least 80 on-time arrivals is greater than the number of days that had at most 76 on-time arrivals. D. The number of days that had from 76 to 80 on-time arrivals is equal to the number of days that had at most 76 on-time arrivals. E. The difference between the median and the lower quartile for the number of on-time arrivals is less than 2. 4. A sociologist collected data from a sample of people on their highest level of education and the number of times they visited any fast food restaurant during the previous week. The data are summarized in the boxplots. High school Community college Four-year college More than four-year college VISITS BY HIGHEST EDUCATION LEVEL 0 1 + 2 3 Number of Visits 4 5 Based on the boxplots, which of the following statements must be true? A. The number of people surveyed at the more than four-year college level is greater than the number of people surveyed at the high school level. B. The proportion of people surveyed from the first quartile to the third quartile at the four-year college level is less than the respec- tive proportion at the community college level. C. The interquartile range (IQR) for the number of visits at the more than four-year college level is less than the IQR for the number of visits at the community college level. D. The maximum number of visits at the community college level is greater than the maximum number of visits at the high school level. E. The median number of visits at the four-year college level is greater than the median number of visits at the high school level. Topic: Histogram IQR 估算 5. A marketing firm obtained random samples of 20 people in five regions of the country to investigate the level of interest in a new product. People in the sample were asked to rate their level of interest on a scale from 1 to 10 , with 1 being the least amount of interest and 10 being the greatest. The histograms show the results for each region. The graph for which region displays data for level of interest with the least standard deviation? Region A A. Frequency 8+ 6- 4 2 0 1 2 3 4 5 6 7 8 9 10 Level of Interest Region B B. Frequency 8+ 6- 4- 2 0 1 2 3 4 5 6 7 8 9 10 Level of Interest Region C C. Frequency 8+ 6- 4- 2 0 1 2 3 4 5 6 7 8 9 10 Level of Interest Region D D. Frequency 8+ 6+ 4+ 2 0 1 2 3 4 5 6 7 8 9 10 Level of Interest Region E E. Frequency 8- 6 4- 2 0 1 2 3 4 5 6 7 8 9 10 Level of Interest 6. The histogram shown summarizes the responses of 100 people when asked, "What was the price of the last meal you purchased?" Frequency 25 22 20 15+ 14 13 10-8 88 5- 5 3 5 0 2 1 $5 $9 $13 $17 $21 $25 $29 $33 $37 $41 $45 Price Based on the histogram, which of the following could be the interquartile range of the prices? A. $40 B. $21 C. $10 D. $5 Ε. $3 7. The histogram shows the distribution of heights, in inches, of 100 adult men. Frequency 12 10 8 6 4 2 0 11 10 10 9 8 8 6 6 5 5 4 3 3 22 22 1 55 56 57 58 59 60 61 62 63 64 65 66 67 68 69 70 71 72 73 74 75 76 77 78 79 80 Height (inches) Based on the histogram, which of the following is closest to the interquartile range, in inches, of the distribution? A. 2 B. 5 C. 9 D. 12 E. 15 Topic: Dotplot 分布形状 (bimodal 8. A group of students played a game in which they earned points for answering questions correctly. The following dotplot shows the total number of points earned by each student. 3 6 9 12 Points Earned 15 18 21 Which of the following is the best description of the distribution of points earned? A. Approximately normal B. Bimodal without a gap C. Bimodal with a gap D. Skewed to the right without a gap E. Skewed to the right with a gap 9. The following dotplot shows the scores of 25 people who played an online trivia game. + + + :: : + + + 50 55 60 65 70 75 80 85 90 95 100 Score Which of the following statements is the best description of the distribution of scores? A. The distribution is roughly symmetric. B. The distribution is roughly uniform. C. The distribution is skewed left. D. The distribution is skewed right. E. The distribution is bimodal. 10. Grain moisture is a characteristic of grain that affects the price paid for the grain. A random sample of 28 loads of corn was evaluated for moisture as a percent of the total weight. A different random sample of 28 loads of soybeans was also evaluated for moisture. The data are displayed in the dotplots below. Corn 8% 10% 12% 14% 16% 18% 20% Soybeans : : : 8% 10% 12% 14% Percent Moisture 16% 18% 20% Based on the dotplots, which of the following is greater for the percent mois- ture of corn than for the percent moisture of soybeans? A. The first quartile B. The median C. The third quartile D. The range E. The interquartile range 11. Of the following dotplots, which represents the set of data that has the greatest standard deviation? ** * * * * * * * * 0 10 A. ***** ***** B. 0 10 *** **** *** C. 0 10 **** ** **** D. 0 10 ** ****** ** E. 0 10 Topic:茎叶图中位数和范围比较 12. A school is having a contest in which students guess the number of candies in a jar. The student whose guess is closest to the correct number of candies in the jar wins a prize. The number of candies guessed by male and female students is shown in the back-to-back stemplot below. Male Female 6 4 2 7 58 1 8 09 0 9 005 00 10 0014 5530 11 005788 12 0112 5554210 865000 13 950 14 Key: 6|4 = 64 Which of the following statements is true about the distributions of guesses? A. The distribution of guesses for male students is skewed to the left, and the distribution of guesses for female students is skewed to the right. B. The distribution of guesses for male students is skewed to the right, and the distribution of guesses for female students is skewed to the left. C. The distributions of guesses for male and female students are both skewed to the right. D. The distributions of guesses for male and female students are both skewed to the left. E. The distributions of guesses for male and female students are both symmetric. 13. The back-to-back stem-and-leaf plot below gives the percentage of students who dropped out of school at each of the 49 high schools in a large metropoli- tan school district. School Year 1989-1990 04 School Year 1992-1993 9999887056 6 6 7 7 7 8 8 899 4 4 4444 4 4 4 3 3 2 2 2 2111101000011112 2 2 3 3 4 4 4 4 99 9 7 7 6 6 6 6 5 1555 6 6 6 6 7 7 7 7 8 4 2 2 2 100213 88 8 7 6 2 230112 766 3 5 4 For 1992-1993, 1|2 represents 12%. Which of the following statements is NOT justified by these data? A. The drop-out rate decreased in each of the 49 schools between the 1989-90 and 1992-1993 school years. B. For the school years shown, most students in the 49 schools did not drop out of high school. C. In general drop-out rates decreased between the 1989-90 and 1992- 1993 school years. D. The median drop-out rate of the 49 high schools decreased between the 1989-90 and 1992-1993 school years. E. The spread between the schools with the lowest drop-out rates and those with the highest drop-out rates did not change much between the 1989-90 and 1992-1993 school years. 14. In northwest Pennsylvania, a zoologist recorded the ages, in months, of 55 bears and whether each bear was male or female. The data are shown in the back-to-back stemplot below. Female Male 4 15 14 20 13 12 11 10 4 9 2 8 1 7 0 10 6 6 832 5 35 65421 4 6 885432 3 2478 9762100 2 00122344456779 1 578 7|0 represents 70 months Based on the stemplot, which of the following statements is true? A. The median age and the range of ages are both greater for female bears than for male bears. B. The median age and the range of ages are both less for female bears than for male bears. C. The median age is the same for female bears and male bears, and the range of ages is the same for female bears and male bears. D. The median age is less for female bears than for male bears, and the range of ages is greater for female bears than for male bears. E. The median age is greater for female bears than for male bears, and the range of ages is less for female bears than for male bears. Topic: Histogram 求 IQR 15. Data on homes recently sold in a certain town included the area of the home, reported in square feet. The table below shows summary statistics of the reported areas, in square feet. Mean Minimum Q1 Median Q3 Maximum Standard Deviation 1.754.14 1.656 1.704 1.758 1.806 1.843 61.0723 An auditor determined that an error was made in the reported areas and that all of the areas should have been 100 square feet greater than what was reported. The areas were corrected and new summary statistics were reported. What are the interquartile range (IQR) and the standard deviation of the corrected areas? A. IQR 102, standard deviation 61.0723 B. IQR 102, standard deviation 161.0723 C. IQR 202, standard deviation 61.0723 D. IQR 202, standard deviation 161.0723 E. IQR 187, standard deviation 61.0723 Topic: Histogram 求 Median 16. A random sample of 25 households from the Mountainview School District was surveyed. In this survey, data were collected on the age of the youngest child living in each household. The histogram below displays the data col- lected in the survey. Frequency 9+ 8 7 6 5 4 432 5 8 3 2 2 1 1 0 0 2 4 6 Age (in years) 8 10 12 14 In which of the following intervals is the median of these data located? A. 0 years old to less than 2 years old B. 4 years old to less than 6 years old C. 6 years old to less than 8 years old D. 8 years old to less than 10 years old E. 10 years old to less than 12 years old 17. The histogram below displays the frequencies of waiting times, in minutes, for 175 patients in a dentist's office. Number of Patients 100+ 80+ 60- 40- 20 0 0 5 10 15 20 25 30 Waiting Time (minutes) Which of the following could be the median of the waiting times, in minutes? A. 2.50 Β. 7.25 C. 12.25 D. 15.00 Ε. 17.50 18. One way to measure the duration of subterranean disturbances such as earth- quakes and mining is to calculate the root-mean-square time. The following histograms summarize the distributions of the root-mean-square times for two sources of disturbances. Relative Frequency 0.40 0.35 0.30- 0.25- 0.20- 0.15- 0.10- 0.05- Earthquake Disturbances 0.0+ 0.0 0.2 0.4 0.6 0.8 1.0 1.2 1.4 1.6 Root Mean Square Time Relative Frequency Mining Disturbances 0.40 0.35 0.30- 0.25- 0.20- 0.15- 0.10- 0.05- 0.0+ + 0.0 0.2 0.4 0.6 0.8 1.0 1.2 1.4 1.6 Root Mean Square Time Based on the histograms, which of the following correctly compares the two distributions? A. The median of the earthquake disturbances is equal to the median of the mining disturbances. B. The median of the earthquake disturbances is less than the median of the mining disturbances. C. The range of the earthquake disturbances is equal to the range of the mining disturbances. D. The range of the earthquake disturbances is less than the range of the mining disturbances. E. The mode of the earthquake disturbances is equal to the mode of the mining disturbances. 19. The prices, in thousands of dollars, of 304 homes recently sold in a city are summarized in the histogram below. Number of Homes Sold 140 120 120- 100 82 80 60 40 38 38 20 0 10 8 5 2 1 250 500 750 1,000 1,250 1,500 1,750 2,000 2,250 2,500 Price (thousands of dollars) Based on the histogram, which of the following statements must be true? A. The minimum price is $250,000. B. The maximum price is $2,500,000. C. The median price is not greater than $750,000. D. The mean price is between $500,000 and $750,000. E. The upper quartile of the prices is greater than $1,500,000. Topic:频数表求 Median 20. The following list shows the selling prices of 8 houses in a certain town. House Price House Price A $302,100 E $275,800 B $275,800 F $295,000 C $305,400 G $281,900 D $250,600 | Η $284, 700 What is the median selling price of the houses in the list? A. $263, 200 Β. $283,300 C. $288, 450 D. $290,600 Ε. $293, 400 21. The following table shows summary statistics for the number of hours a group of students spent playing video games last Monday and last Saturday. Day Minimum Q1 Median Q3 Maximum Monday 0 1 2 4 12 Saturday 1 4 6 8 18 Based on the summary statistics, which of the following gives the best com- parison of the range and the interquartile range (IQR) of the two days? A. The range and IQR of hours played on Monday are both greater than the range and IQR of hours played on Saturday. B. The range and IQR of hours played on Monday are both less than the range and IQR of hours played on Saturday. C. The range and IQR of hours played on Monday are both equal to the range and IQR of hours played on Saturday. D. The range of hours played on Monday is greater than the range of hours played on Saturday, and the IQR of hours played on Monday is less than the IQR of hours played on Saturday. E. The range of hours played on Monday is less than the range of hours played on Saturday, and the IQR of hours played on Monday is greater than the IQR of hours played on Saturday. 22. The prices, in thousands of dollars, of the 35 used cars at a certain car dealership are shown in the table below. Price (in thousands) $7 $8 $9 $10 $11 $12 $13 $14 $15 $16 Frequency 4 6 7 6 4 2 2 2 1 1 Which of the following best describes the shape of the distribution of used car prices at the dealership? A. Skewed to the left (negatively skewed) B. Skewed to the right (positively skewed) C. Bimodal D. Uniform E. Approximately normal 23. Heights, in inches, for the 200 graduating seniors from Washington High School are summarized in the frequency table below. Height Frequency Height < 60 inches 22 60 inches < height < 66 inches 84 66 inches < height < 72 inches 62 72 inches < height < 78 inches 24 Height ≥ 78 inches 8 Which of the following statements about the median height is true? A. It is greater than or equal to 78 inches. B. It is greater than or equal to 72 inches but less than 78 inches. C. It is greater than or equal to 66 inches but less than 72 inches. D. It is greater than or equal to 60 inches but less than 66 inches. E. It is less than 60 inches. Topic:标准差比较 (dotplot) 24. At a photography contest, entries are scored on a scale from 1 to 100. At a recent contest with 1,000 entries, a score of 68 was at the 77 th percentile of the distribution of all the scores. Which of the following is the best description of the 77th percentile of the distribution? A. There were 770 entries with a score less than or equal to 68. B. There were at least 230 entries with a score of 77. C. There were 23 C. There were 77 C. There were at least 77 Topic:相关系数解释 25. At a large airport, data were recorded for one month on how many baggage items were unloaded from each flight upon arrival as well as the time required to deliver all the baggage items on the flight to the baggage claim area. A scatterplot of the two variables indicated a strong, positive linear associa- tion between the variables. Which of the following statements is a correct interpretation of the word "strong" in the description of the association? A. A least-squares model predicts that the more baggage items that are unloaded from a flight, the greater the time required to deliver the items to the baggage claim area. B. The actual time required to deliver all the items to the baggage claim area based on the number of items unloaded will be very close to the time predicted by a least-squares model. C. The time required to deliver an item to the baggage claim area is relatively constant, regardless of the number of baggage items unloaded from a flight. D. The variability in the time required to deliver all items to the baggage claim area is about the same for all flights, regardless of the number of items unloaded from a flight. E. The time required to unload baggage items from a flight is related to the time required to deliver the items to the baggage claim area. 26. A tennis ball was thrown in the air. The height of the ball from the ground was recorded every millisecond from the time the ball was thrown until it reached the height from which it was thrown. The correlation between the time and height was computed to be 0. What does this correlation suggest about the relationship between the time and height? A. There is no relationship between time and height. B. There is no linear relationship between time and height. C. The distance the ball traveled upward is the same as the distance the ball traveled downward. D. The correlation suggests that there is measurement or calculation error. E. The correlation suggests that more measurements should be taken to better understand the relationship. 27. A restaurant manager collected data on the number of customers in a party in the restaurant and the time elapsed until the party left the restaurant. The manager computed a correlation of 0.78 between the two variables. What information does the correlation provide about the relationship between the number of customers in a party at the restaurant and the time elapsed until the party left the restaurant? A. The relationship is linear because the correlation is positive. B. The relationship is not linear because the correlation is positive. C. The parties with a larger number of customers are associated with the longer times elapsed until the party left the restaurant. D. The parties with a larger number of customers are associated with the shorter times elapsed until the party left the restaurant. E. There is no relationship between the number of customers in a party at a table in the restaurant and the time required until the party left the restaurant. 28. A botanist found a correlation between the length of an aspen leaf and its surface area to be 0.94. Why does the correlation value of 0.94 not necessarily indicate that a linear model is the most appropriate model for the relationship between length of an aspen leaf and its surface area? A. The value must be exactly 1 or -1 to indicate a linear model is the most appropriate model. B. The value must be 0 to indicate a linear model is the most appro- priate model. C. A causal relationship should be established first before determining the most appropriate model. D. The value of 0.94 implies that only 88 D. Even with a correlation value of 0.94, it is possible that the rela- tionship could still be better represented by a nonlinear model. Job No Job Total Juniors 13 5 18 Seniors 13 26 39 Total 26 31 57 A survey of 57 students was conducted to determine whether or not they held jobs outside of school. The two-way table above shows the number of students by employment status (job, no job), and class (juniors, seniors). Which of the following best describes the relationship between employment status and class? A. There appears to be no association, since the same number of ju- niors and seniors have jobs. B. There appears to be no association, since close to half of the stu- dents have jobs. C. There appears to be an association, since there are more seniors than juniors in the survey. D. There appears to be an association, since the proportion of juniors having jobs is much larger than the proportion of seniors having jobs. E. A measure of association cannot be determined from these data. Topic:常数变换后相关系数不变 29. Which of the following scatterplots could represent a data set with a corre- lation coefficient of r=-1? 4 3 2 1 0 20 40 60 80 100 A. 4 3 2 1 0 20 40 60 80 100 Β. 4 3 2 1 0 20 40 60 80 100 C. 4 3 2 1 0 20 40 60 80 100 D. 4 3 2 1 0 20 40 60 80 100 Ε. 30. A researcher in Alaska measured the age (in months) and the weight (in pounds) of a random sample of adolescent moose. When the least-squares regression analysis was performed, the correlation was 0.59. Which of the following is the correct way to label the correlation? A. 0.59 months per pound B. 0.59 pounds per month C. 0.59 D. 0.59 months times pounds E. 0.59 month pounds 31. A restaurant manager collected data to predict monthly sales for the restau- rant from monthly advertising expenses. The model created from the data showed that 36 percent of the variation in monthly sales could be explained by monthly advertising expenses. What was the value of the correlation coefficient? A. 0.64 Β. 0.60 C. 0.40 D. 0.36 Ε. 0.13 32. Suppose a certain scale is not calibrated correctly, and as a result, the mass of any object is displayed as 0.75 kilogram less than its actual mass. What is the correlation between the actual masses of a set of objects and the respective masses of the same set of objects displayed by the scale? A. -1 B. -0.75 C. 0 D. 0.75 Ε. 1 X y 1 3 2 4 3 7 4 8 5 12 The table shows several values of x and their corresponding values of y. Which of the following is closest to the correlation between x and y ? A. -0.98 B. -0.95 C. 0.20 D. 0.95 Ε. 0.98 Topic:残差图判断线性模型 33. An experiment was conducted to investigate the relationship between the dose of a pain medication and the number of hours of pain relief. Twenty individuals with chronic pain were randomly assigned to one of five doses -0.0, 0.5, 1.0, 1.5, 2.0-in milligrams (mg) of medication. The results are shown in the scatterplot below. 14- 12- 10- 8- 6 : 4- Pain Relief (hours) 2 : 0 0.0 + 0.5 1.0 + 1.5 2.0 Dose (mg) The data were used to fit a least-squares regression line to predict the number of hours of pain relief for a given dose. Which of the following would be revealed by a plot of the residuals of the regression versus the dose? A. The sum of the residuals is less than 0. B. The sum of the residuals is greater than 0. C. There are outliers associated with the lower doses. D. The variation in the hours of pain relief is not the same across the doses. E. There is a positive linear relationship between the residuals and the dose. 34. The following is a residual plot for a linear regression of y versus x. Residual 7.5+ 5.0+ 2.5- 0.0 -2.5- -5.0 + 0 5 10 + 15 20 X What is indicated by the plot? A. A linear model is appropriate. B. A linear model is not appropriate. C. Variability in y is constant for all values x. D. At least one point is influential with respect to the regression. E. At least one point is an outlier with respect to the regression. 35. An engineer believes that there is a linear relationship between the thickness of an air filter and the amount of particulate matter that gets through the filter; that is, less pollution should get through thicker filters. The engineer tests many filters of different thickness and fits a linear model. If a linear model is appropriate, what should be apparent in the residual plot? A. There should be a positive, linear association in the residual plot. B. There should be a negative, linear association in the residual plot. C. All of the points must have residuals of 0. D. There should be no pattern in the residual plot. E. The residuals should have a small amount of variability for low values of the predictor variable and larger amounts of variability for high values of the predictor variable. Topic:回归斜率解释 36. A researcher collected data on the age, in years, and the growth of sea turtles. The following graph is a residual plot of the regression of growth versus age. 0.6- Residuals 0.4- 0.2- 0.0- -0.2- -0.4- -0.6+ 0 1 2 3 4 5 6 Age in Years Does the residual plot support the appropriateness of a linear model? A. Yes, because there is a clear pattern displayed in the residual plot. B. Yes, because about half the residuals are positive and the other half are negative. C. Yes, because as age increases, the residuals increase. D. No, because the points appear to be randomly distributed. E. No, because the graph displays a U-shaped pattern. Topic:回归斜率解释 37. A researcher collected data on the latitude, in degrees north of the equator, and the average low temperature, in degrees Fahrenheit, for a random sample of cities in Europe. The data were used to create the following equation for the least-squares regression line. predicted average low temperature = 65.5 - 0.70 (latitude) Which of the following is the best interpretation of the slope of the line? A. For each one degree north of the equator increase, the predicted av- erage low temperature increases on average by 0.70 degree Fahren- heit. B. For each one degree north of the equator increase, the predicted av- erage low temperature decreases on average by 0.70 degree Fahren- heit. C. For each 0.70 degree north of the equator increase, the predicted average low temperature decreases on average by 1 degree Fahren- heit. D. For each one degree Fahrenheit increase in average low temper- ature, the predicted latitude increases on average by 0.70 degree north of the equator. E. For each one degree Fahrenheit increase in average low tempera- ture, the predicted latitude decreases on average by 0.70 degree north of the equator. 38. Exercise physiologists are investigating the relationship between lean body mass (in kilograms) and the resting metabolic rate (in calories per day) in sedentary males. Predictor Coef StDev T P Constant 264.0 276.9 0.95 0.363 Mass 22.563 6.360 3.55 0.005 S = 144.9 R-Sq = 55.7 Based on the computer output above, which of the following is the best interpretation of the value of the slope of the regression line? A. For each additional kilogram of lean body mass, the resting metabolic rate increases on average by 22.563 calories per day. B. For each additional kilogram of lean body mass, the resting metabolic rate increases on average by 264.0 calories per day. C. For each additional kilogram of lean body mass, the resting metabolic rate increases on average by 144.9 calories per day. D. For each additional calorie per day for the resting metabolic rate, the lean body mass increases on average by 22.563 kilograms. E. For each additional calorie per day for the resting metabolic rate, the lean body mass increases on average by 264.0 kilograms. 39. An agriculturalist working with Australian pine trees wanted to investigate the relationship between the age and the height of the Australian pine. A random sample of Australian pine trees was selected, and the age, in years, and the height, in meters, was recorded for each tree in the sample. Based on the recorded data, the agriculturalist created the following regression equation to predict the height, in meters, of the Australian pine based on the age, in years, of the tree. predicted height = 0.29 +0.48 (age) Which of the following is the best interpretation of the slope of the regression line? A. The height increases, on average, by 1 meter each 0.48 year. B. The height increases, on average, by 0.48 meter each year. C. The height increases, on average, by 0.29 meter each year. D. The height increases, on average, by 0.29 meter each 0.48 year. E. The difference between the actual height and the predicted height is, on average, 0.48 meter for each year. 40. The computer output below shows the result of a linear regression analysis for predicting the concentration of zinc, in parts per million ( ppm ), from the concentration of lead, in ppm, found in fish from a certain river. Response variable is Zinc (ppm) Variable Coefficient Std Dev T P Constant 16.3 4.90 3.32 0.003 Lead (ppm) 19.0 1.89 10.01 0.000 S = 16.17 R - Sq = 82.0 Which of the following statements is a correct interpretation of the value 19.0 in the output? A. On average there is a predicted increase of 19.0ppm in concentra- tion of lead for every increase of 1ppm in concentration of zinc found in the fish. B. On average there is a predicted increase of 19.0ppm in concentra- tion of zinc for every increase of 1ppm in concentration of lead found in the fish. C. The predicted concentration of zinc is 19.0ppm in fish with no concentration of lead. D. The predicted concentration of lead is 19.0ppm in fish with no concentration of zinc. E. Approximately 19 Topic:补集概率 (complement probability) 41. At a sporting event, cheerleaders will throw 50 bundled T-shirts into the crowd. The T-shirt sizes consist of 10 small, 15 medium, and the remainder either large or extra large. Suppose Ana catches a T-shirt. What is the probability that she will catch a T-shirt that is not a size small? A. 0.10 B. 0.20 C. 0.50 D. 0.67 Ε. 0.80 42. A large store has a customer service department where customers can go to ask for help with store-related issues. According to store records, ap- proximately 1/4 of all customers who go to the service department ask for help finding an item. Assume the reason each customer goes to the service department is independent from customer to customer. Based on the ap- proximation, what is the probability that at least 1 of the next 4 customers who go to the service department will ask for help finding an item? A. 4(1/4) B. 1-(3/4) C. 1-(3/4)^4 D. 4(1/4)(3/4)^3 E. (1/4)(3/4)(3/4)(1/4) 43. A police officer is using a radar device to check motorists' speeds. Prior to beginning the speed check, the officer estimates that 40 percent of motorists will be driving more than 5 miles per hour over the speed limit. Assuming that the police officer's estimate is correct, what is the probability that among 4 randomly selected motorists, the officer will find at least 1 motorist driving more than 5 miles per hour over the speed limit? A. 0.0256 Β. 0.1296 C. 0.3456 D. 0.8704 Ε. 0.9744 Topic:组合概率 (combination probability) 44. A middle school chess club has 5 members: Adam, Bradley, Carol, Dave, and Ella. Two students from the club will be selected at random to participate in the county chess tournament. What is the probability that Adam and Ella will be selected? A. 1/20 B. 1/10 C. 1/8 D. 1/2 Ε. 1/4 Topic:独立事件判断 (independent events) 45. The SC Electric Company has bid on two electrical wiring jobs. The owner of the company believes that the probability of being awarded the first job (event A ) is 0.75; the probability of being awarded the second job (event B) is 0.5; and the probability of being awarded both jobs (event (A and B) ) is 0.375. If the owner's beliefs are correct, which of the following statements must be true concerning event A and event B ? A. Event A and event B are mutually exclusive and are independent. B. Event A and event B are mutually exclusive and are not indepen- dent. C. Event A and event B are not mutually exclusive and are indepen- dent. D. Event A and event B are not mutually exclusive and are not inde- pendent. E. Event A and event B are not mutually exclusive, and independence cannot be determined with the information given. 46. Ms. Tucker travels through two intersections with traffic lights as she drives to the market. The traffic lights operate independently. The probability that both lights will be red when she reaches them is 0.22. The probability that the first light will be red and the second light will not be red is 0.33. What is the probability that the second light will be red when she reaches it? A. 0.40 Β. 0.45 C. 0.50 D. 0.55 Ε. 0.60 47. For which of the following probability assignments are events A and B inde- pendent? A. P(A ∩ B) = 0.3, P(A ∩ B) = 0.12, and P (Aº∩ B) = 0.4. B. P (A ∩ B) = 0.3, P(A ∩ B) = 0.3, and P(A ∩ B) = 0.3. C. P(A ∩ B) = 0.1, P(A ∩ B) = 0.1, and P (Aº∩ B) = 0.4. D. P (A ∩ B) = 0.3, P(A ∩ B) = 0.0, and P (Aº∩ B) = 0.2. E. P (A ∩ B) = 0.5, P(A ∩ B) = 0.1, and P (Aº∩ B) = 0.4. 48. Events D and E are independent, with P(D) = 0.6 and P(D and E) = 0.18. Which of the following is true? A. P(E) = 0.12 B. P(E) = 0.4 C. P(D or E) = 0.28 D. P(D or E) = 0.72 E. P(D or E) = 0.9 Topic:条件概率 (conditional probability) 49. At a small company, 40 percent of the employees are classified as junior level, and 32 percent of the employees work in department A. Of those classified as junior level, 55 percent work in department A. One employee will be selected at random. What is the probability that the selected employee works in department A and is not classified as junior level? A. 0.10 Β. 0.19 C. 0.22 D. 0.32 Ε. 0.50 50. A contestant's final winnings on a game show are determined by a random selection of a base amount and a possible multiplier. For the base amount, the contestant randomly selects one of four cards, where two cards are marked $1,000, one card is marked $2,000, and one card is marked $5,000. After choosing the card, the contestant randomly selects one of five chips, where three chips are red and two chips are white. If the selected chip is red, the contestant's final winnings are twice the value of the base amount. If the selected chip is white, the contestant's final winnings are the value of the base amount. What is the probability that a contestant's final winnings are exactly $2,000 ? A. 0.100 Β. 0.200 C. 0.250 D. 0.325 Ε. 0.400 51. The probability that a new microwave oven will stop working in less than 2 years is 0.05. The probability that a new microwave oven is damaged during delivery and stops working in less than 2 years is 0.04. The probability that a new microwave oven is damaged during delivery is 0.10. Given that a new microwave oven is damaged during delivery, what is the probability that it stops working in less than 2 years? A. 0.05 B. 0.06 C. 0.10 D. 0.40 Ε. 0.50 52. One student from a high school will be selected at random. Let A be the event that the selected student is a student athlete, and let B be the event that the selected student drives to school. If P(A ∩ B) = 0.08 and P(B | A) = 0.25, what is the probability that the selected student will be a student athlete? A. 0.02 B. 0.17 C. 0.32 D. 0.33 Ε. 3.13 Topic:条件概率 (conditional probability) 53. Each of the faces of a fair six-sided number cube is numbered with one of the numbers 1 through 6, with a different number appearing on each face. Two such number cubes will be tossed, and the sum of the numbers appearing on the faces that land up will be recorded. What is the probability that the sum will be 4, given that the sum is less than or equal to 6? A. 2/36 Β. 3/36 C. 3/15 D. 2/9 Ε. 4/6 The following question(s) refer to the following scenario and set of data. In the 1830s, land surveyors began to survey the land acquired in the Louisiana Purchase. Part of their task was to note the sizes of trees they encountered in their surveying. The table of data below is for bur oak trees measured during the survey. Tree Diameter (in inches) Frequency Relative Frequency Cumulative Frequency Cumulative Relative Frequency 4 2 0.005 2 0.005 5 5 0.012 7 0.016 6 19 0.044 26 0.060 7 5 0.012 31 0.072 8 41 0.095 72 0.167 9 12 0.028 84 0.195 10 53 0.123 137 0.318 11 3 0.007 140 0.325 12 64 0.148 204 0.473 13 4 0.009 208 0.483 14 46 0.107 254 0.589 15 11 0.026 265 0.615 16 48 0.111 313 0.726 17 2 0.005 315 0.731 18 47 0.109 362 0.840 19 20 30 0.070 392 0.910 21 22 4 0.009 396 0.919 23 24 18 0.042 414 0.961 25 26 1 0.002 415 0.963 27 28 2 0.005 417 0.968 29 30 8 0.019 425 0.986 31 32 33 34 1 0.002 426 0.988 35 1 0.002 427 0.991 36 3 0.007 430 0.998 37 38 1 0.002 431 1.000 Which of the following differences in cumulative relative frequencies gives the proportion of trees that are 12 inches to 16 inches, inclusive, in diameter? A. 0.615 - 0.325 Β. 0.615 - 0.473 С. 0.726- 0.325 D. 0.726- 0.473 Ε. 0.731 0.325 54. The distribution of number of hours worked by volunteers last year at a large hospital is approximately normal with mean 80 and standard deviation 7. Volunteers in the top 20 percent of hours worked will receive a certificate of merit. If a volunteer from last year is selected at random, which of the following is closest to the probability that the volunteer selected will receive a certificate of merit given that the number of hours the volunteer worked is less than 90? A. 0.077 Β. 0.123 C. 0.134 D. 0.618 Ε. 0.923 55. Mating eagle pairs typically have two baby eagles (called eaglets). When there are two eaglets, the parents always feed the older eaglet until it has had its fill, and then they feed the younger eaglet. This results in an unequal chance of survival for the two eaglets. Suppose that the older eaglet has a 50 percent chance of survival. If the older eaglet survives, the younger eaglet has a 10 percent chance of survival. If the older eaglet does not survive, the younger eaglet has a 30 percent chance of survival. Let X be the number of eaglets that survive. Which of the following tables shows the probability distribution of X ? X 0 1 2 A. p(x) 1/3 1/3 1/3 X 0 1 2 Β. p(x) 1/4 1/2 1/4 X 0 1 2 C. p(x) 0.35 0.60 0.05 X 0 1 2 D. p(x) 0.05 0.90 0.05 X 0 1 2 Ε. p(x) 0.10 0.30 0.50 Topic:双向表的条件概率 (two-way table conditional probability) 56. Students at a local elementary school were shown a painting and asked which emotion-joy, happiness, love, or anger-they felt by looking at the painting. The students were classified by their age. The following table summarizes the responses of the students by age-group. Joy Happiness Love Anger Total 6 to 8 years 28 20 40 18 106 9 to 11 years 61 25 80 60 226 Total 89 45 120 78 332 One student from the school will be selected at random. What is the prob- ability that the student is in the age-group of 6 to 8 years given that the selected student responded joy? A. 89/332 Β. 28/332 C. 28/106 D. 106/332 Ε. 28/89 57. The seniors at three high schools were surveyed about their plans after grad- uation. The following table shows the responses, classified by high school. Work Military College Undecided Total High School A 99 49 138 63 349 High School B62 26 156 54 298 High School C 83 31 124 71 309 Total 244 106 418 188 956 One senior from the high schools will be selected at random. What is the probability that the senior selected will not be from High School B given that the senior responded with a choice other than college? A. 156/418 B. 538/956 C. 262/418 D. 658/956 Ε. 396/538 58. The table shows the responses from 103 people when asked if they support a proposal to expand the public library. Under the Age of 55 Age 55 or Older Total Yes 17 8 25 No 42 36 78 Total 59 44 103 One person from those who responded will be selected at random. Which of the following is closest to the probability that the person selected will be someone who responded no, given that the person selected is age 55 or older? A. 0.350 B. 0.427 C. 0.462 D. 0.757 Ε. 0.818 59. Ali surveyed 200 students at a school and recorded the eye color and the gender of each student. Of the 80 male students who were surveyed, 60 had brown eyes. If eye color and gender are independent, how many female students surveyed would be expected to have brown eyes? A. 5 B. 20 C. 30 D. 90 Ε. 100 Topic:期望值计算 (expected value) 60. A box contains 10 tags, numbered 1 through 10, with a different number on each tag. A second box contains 8 tags, numbered 20 through 27, with a different number on each tag. One tag is drawn at random from each box. What is the expected value of the sum of the numbers on the two selected tags? A. 13.5 Β. 14.5 C. 15.0 D. 27.0 Ε. 29.0 61. A city department of transportation studied traffic congestion on a certain highway. To encourage carpooling, the department will recommend a carpool lane if the average number of people in passenger cars on the highway is less than 2. The probability distribution of the number of people in passenger cars on the highway is shown in the table. Number of people 1 2 3 4 5 Probability 0.56 0.28 0.08 0.06 0.02 Based on the probability distribution, what is the mean number of people in passenger cars on the highway? A. 0.28 Β. 0.56 C. 1.7 D. 2 Ε. 3 62. A magazine has 1,620,000 subscribers, of whom 640,000 are women and 980,000 are men. Thirty percent of the women read the advertisements in the magazine and 50 percent of the men read the advertisements in the magazine. A random sample of 100 subscribers is selected. What is the expected number of subscribers in the sample who read the advertisements? A. 30 B. 40 C. 42 D. 50 Ε. 80 Topic:线性变换随机变量的期望/游戏期望值 63. The following table shows the probability distribution for the number of books a student typically buys at the annual book fair held at an elementary school. Number of Books 0 1 2 3 4 5 6 7 Probability 0.35 0.20 0.15 0.10 0.07 0.08 0.04 0.01 Let the random variable B represent the number of books a student buys at the next book fair. What is the expected value of B? A. 0 B. 1.00 C. 1.79 D. 3.50 Ε. 28 Topic:期望值计算 (expected value) 64. In a certain game, a fair die is rolled and a player gains 20 points if the die shows a "6." If the die does not show a "6," the player loses 3 points. If the die were to be rolled 100 times, what would be the expected total gain or loss for the player? A. A gain of about 1,700 points B. A gain of about 583 points C. A gain of about 83 points D. A loss of about 250 points E. A loss of about 300 points 65. The number of tickets purchased by a customer for a musical performance at a certain concert hall can be considered a random variable. The table below shows the relative frequency distribution for the number of tickets purchased by a customer. Number of tickets purchased 1 2 3 4 5 Relative frequency 0.20 0.45 0.10 0.20 0.05 Suppose each ticket for a certain musical performance cost $12. Based on the distribution shown, what is the mean cost per customer for the performance? A. $2.45 Β. $2.75 C. $24.50 D. $29.40 Ε. $36.00 66. A player pays $15 to play a game in which a chip is randomly selected from a bag of chips. The bag contains 10 red chips, 4 blue chips, and 6 yellow chips. The player wins $5 if a red chip is selected, $10 if a blue chip is selected, and $20 if a yellow chip is selected. Let the random variable X represent the amount won from the selection of the chip, and let the random variable W represent the total amount won, where W = X - 15. What is the mean of W? A. $10.50 Β. $4.50 C. -$4.50 D. -$6.50 Ε. -$10.50 Topic: 概率分布的期望值 (expected value of probability distribu- tion) 67. According to a survey about how workers get to work in Wyoming, 77 percent of workers get to work by driving alone, 11 percent get to work by carpooling, 4 percent get to work by walking, and 8 percent get to work by other means of transportation. Suppose a sample of 200 Wyoming workers is selected at random. Let the random variable D represent the number of workers in the sample who get to work by driving alone. What is the expected value of D ? A. 8 B. 16 C. 22 D. 46 Ε. 154 68. For a certain dog breed, the number of puppies in a litter typically varies from 2 to 6. The following table shows the probability distribution of the random variable N, where N represents the number of puppies in a litter. Also shown are the squared deviations, or distances, from the expected value of 4.5 for the distribution. Number of puppies 2 3 4 5 6 Squared deviation 6.25 2.25 0.25 0.25 2.25 Probability 0.05 0.15 0.25 0.35 0.20 What is the variance of the distribution? A. 1.12 B. 1.25 C. 1.41 D. 1.58 Ε. 2.25 Topic:独立随机变量差的均值和标准差 69. The distribution of random variable R has mean 10 and standard deviation 4. The distribution of random variable S has mean 7 and standard deviation 3. If R and S are independent, what are the mean and standard deviation of the distribution of R-S? A. Mean 3 and standard deviation 1 B. Mean 3 and standard deviation 5 C. Mean 3 and standard deviation 7 D. Mean 17 and standard deviation 1 E. Mean 17 and standard deviation 5 70. Let X be a random variable whose values are the number of dots that appear on the uppermost face when a fair die is rolled. The possible values of X are 1, 2, 3, 4, 5, and 6. The mean of X is 7/2 and the variance of X is 35/12. Let Y be the random variable whose value is the difference (first minus second) between the number of dots that appear on the uppermost face for the first and second rolls of a fair die that is rolled twice. What is the standard deviation of Y? A. √(35/12) B. √(35/12) + √(35/12) C. √(35/12) + (35/12) D. √(35/12) - (35/12) E. 35/12 + 35/12 71. A random variable X has a mean of 120 and a standard deviation of 15 . A random variable Y has a mean of 100 and a standard deviation of 9. If X and Y are independent, approximately what is the standard deviation of X-Y? A. 24.0 Β. 17.5 C. 12.0 D. 6.0 Ε. 4.9 Topic: sampling distribution of sample mean 72. The mean number of pets owned by the population of students at a large high school is 3.2 pets per student with a standard deviation of 1.7 pets. A random sample of 16 students will be selected and the mean number of pets for the sample will be calculated. What is the mean of the sampling distribution of the sample mean for samples of size 16? A. 1.7 B. 3.2 C. 3.2/√16 D. 1.7/√16 E. 1.7/16 73. At a certain high school, the distribution of backpack weight is approxi- mately normal with mean 19.7 pounds and standard deviation 3.1 pounds. A random sample of 5 backpacks will be selected, and the weight, in pounds, of each backpack will be recorded. For samples of size 5, which of the following is the best interpretation of P(x > 22) ≈ 0.05 ? A. The probability that each of the 5 backpacks selected will have a weight above 22 pounds is approximately 0.05. B. The probability that each of the 5 backpacks selected will have a weight above 19.7 pounds is approximately 0.05. C. The probability that the population mean is greater than 22 pounds is approximately 0.05. D. For all samples of size 5, approximately 5 E. For all samples of size 5, the probability that the sample mean will be greater than 22 pounds is approximately 0.05. 74. At a certain bakery, the price of each doughnut is $1.50. Let the random variable D represent the number of doughnuts a typical customer purchases each day. The expected value and variance of the probability distribution of D are 2.6 doughnuts and 3.6 (doughnuts)^2, respectively. Let the random variable P represent the price of the doughnuts that a typical customer pur- chases each day. Which of the following is the standard deviation, in dollars, of the probability distribution of P? A. 1.5(3.6) Β. 1.5/√3.6 C. √1.5(3.6) D. 1.5(2.6) Ε. 1.5/√2.6 Topic: standard deviation of sum of independent random variables 75. A company that makes fleece clothing uses fleece produced from two farms, Northern Farm and Western Farm. Let the random variable X represent the weight of fleece produced by a sheep from Northern Farm. The distribution of X has mean 14.1 pounds and standard deviation 1.3 pounds. Let the random variable Y represent the weight of fleece produced by a sheep from Western Farm. The distribution of Y has mean 6.7 pounds and standard deviation 0.5 pound. Assume X and Y are independent. Let W equal the total weight of fleece from 10 randomly selected sheep from Northern Farm and 15 randomly selected sheep from Western Farm. Which of the following is the standard deviation, in pounds, of W? A. 1.3 +0.5 B. √(1.3^2 +0.5^2) C. √(10(1.3)^2 + 15(0.5)^2) D. √(10^2(1.3)^2 + 15^2(0.5)^2) E. √(1.3^2/10 + 0.5^2/15) 76. At a large regional collegiate women's swim meet, an official records the time it takes each swimmer to swim 100 meters for all swimmers who compete in only one stroke category. The following table shows the mean times and corresponding standard deviations for the collegiate women at the swim meet for each of the four stroke categories. Stroke Category Mean 100 meter Time Standard Deviation Backstroke 55.6 seconds 0.70 seconds Breaststroke 63.3 seconds 0.92 seconds Butterfly 54.4 seconds 0.94 seconds Freestyle 50.2 seconds 0.76 seconds For each of the 4 stroke categories, consider a random variable representing the time of a randomly selected swimmer in that category. What is the standard deviation of the sum of the 4 random variables? A. 0.83 seconds B. 1.67 seconds C. 2.80 seconds D. 3.32 seconds E. 3.76 seconds 77. A company ships gift baskets that contain apples and pears. The distri- butions of weight for the apples, the pears, and the baskets are each ap- proximately normal. The mean and standard deviation for each distribution is shown in the table below. The weights of the items are assumed to be independent. Item Mean Standard Deviation Apple 4.72 ounces 0.20 ounce Pear 5.41 ounces 0.18 ounce Basket 13.25 ounces 1.88 ounces Let the random variable W represent the total weight of 4 apples, 6 pears, and 1 basket. Which of the following is closest to the standard deviation of W? A. 1.90 ounces B. 1.97 ounces C. 2.26 ounces D. 3.76 ounces E. 3.83 ounces Topic: geometric distribution probability 78. A die used in a certain board game has eight faces, of which 3 are red, 3 are yellow, and 2 are blue. Each face is equally likely to land faceup when the die is tossed. In the game, a player tosses the die until blue lands faceup, and the number of tosses before blue lands faceup is counted. For example, a player who tosses the sequence shown in the following table has tossed the die 3 times before blue lands faceup. Toss number 1 2 3 4 Face color yellow yellow red blue What is the probability that a player will toss the die at least 2 times before blue lands faceup? A. 0.1406 Β. 0.4219 C. 0.4375 D. 0.5625 Ε. 0.5781 79. The transaction history at an electronic goods store indicates that 21 percent of customers purchase the extended warranty when they buy an eligible item. Suppose customers who buy eligible items are chosen at random, one at a time, until one is found who purchased the extended warranty. Let the random variable X represent the number of customers it takes to find one who purchased the extended warranty. Assume customers' decisions on whether to purchase the extended warranty are independent. Which of the following is closest to the probability that X > 3; that is, the probability that it takes more than 3 customers who buy an eligible item to find one who purchased the extended warranty? A. 0.131 Β. 0.390 C. 0.493 D. 0.507 Ε. 0.624 80. Of all the fish in a certain river, 20 percent are salmon. Once a year, people can purchase a fishing license that allows them to catch up to 8 fish. Assume each catch is independent. Which of the following represents the probability of needing to catch 8 fish to get the first salmon? A. 0.2 Β. 1/0.2 C. 0.2^8 D. 0.2(0.8)^7 Ε. 0.8(0.2)^7 81. In a certain board game, a player rolls two fair six-sided dice until the player rolls doubles (where the value on each die is the same). The probability of rolling doubles with one roll of two fair six-sided dice is 1/6. What is the probability that it takes three rolls until the player rolls doubles? A. (1/6)^3 B. (5/6)^3 C. (5/6)^2 (1/6) D. (1/6)(5/6)^2 E. (5/6)(1/6)^2 Topic: interpretation of binomial mean 82. In a certain region, 94 percent of the people have a certain characteristic in their blood. Suppose a group of 45 people from the region are selected at random. Let the random variable B represent the number of people in the sample without the characteristic. Random variable B follows a binomial distribution with a mean of 2.7 people. Which of the following is the best interpretation of the mean? A. For all groups of 45 people, the average number of people without the characteristic is 2.7. B. Every group of 45 people will have 2.7 people with the character- istic. C. Every group of 45 people will have 2.7 people without the charac- teristic. D. On average, 2.7 people are selected until finding someone with the characteristic. E. On average, 2.7 people are selected until finding someone without the characteristic. 83. A manufacturer makes lightbulbs and claims that their reliability is 98 per- cent. Reliability is defined to be the proportion of nondefective items that are produced over the long term. If the company's claim is correct, what is the expected number of nondefective lightbulbs in a random sample of 1,000 bulbs? A. 20 B. 200 C. 960 D. 980 Ε. 1,000 84. A company that ships crystal bowls claims that bowls arrive undamaged in 95 percent of the shipments. Let the random variable G represent the number of shipments with undamaged bowls in 25 randomly selected ship- ments. Random variable G follows a binomial distribution with a mean of 23.75 shipments and a standard deviation of approximately 1.09 shipments. Which of the following is the best interpretation of the mean? A. Every shipment of 25 bowls will have 23.75 undamaged bowls. B. Every shipment of 25 bowls will have 23.75 damaged bowls. C. On average, the company receives 23.75 shipments before receiving the first shipment with a damaged bowl. D. For all possible shipments of size 25, the average number of dam- aged shipments is equal to 23.75. E. For all possible shipments of size 25, the average number of un- damaged shipments is equal to 23.75. Topic: conditions for binomial distribution 85. In which of the following should the random variable X not be modeled with a geometric distribution? According to a recent study, approximately 8 A. represent the number of randomly selected adults in the country surveyed to find someone with a master's degree. B. Suppose it is known that 5 C. A particular basketball player is known to consistently make 90 D. In a bag of 30 different colored candies, about 20 E. It is believed that about 40 86. Mateo plays on his school basketball team. From past history, he knows that his probability of making a basket on a free throw is 0.8. Suppose he wants to create a simulation using random numbers to estimate the probability of making at least 3 baskets on his next 5 free throw attempts. Which of the following assignments of the digits 0 to 9 could be used for the simulation? A. Let the even digits represent making a basket and the odd digits represent not making a basket. B. Let the digits 0 and 1 represent making a basket and the digits from 2 to 9 represent not making a basket. C. Let the digits from 0 to 3 represent making a basket and the digits from 4 to 9 represent not making a basket. D. Let the digits from 0 to 6 represent making a basket and the digits from 7 to 9 represent not making a basket. E. Let the digits from 0 to 7 represent making a basket and the digits 8 and 9 represent not making a basket. 87. A carnival game allows the player a choice of simultaneously rolling two, four, six, eight, or ten fair dice. Each die has six faces numbered 1 through 6, respectively. After the player rolls the dice, the numbers that appear on the faces that land up are recorded. The player wins if the greatest number recorded is 1 or 2. How many dice should the player choose to roll to maximize the chance of winning? A. Two B. Four C. Six D. Eight E. Ten 88. A popular computer card game keeps track of the number of games played and the number of games won on that computer. The cards are shuffled before each game, so the outcome of the game is independent from one game to the next and is based on the skill of the player. Let X represent the number of games that have been won out of 100 games. Under which of the following situations would X be a binomial random variable? A. All games were played by the same player, whose skill improved over the course of the 100 games B. A group of 5 players of different skill levels were each allowed to play 20 games in a row. C. A group of players of different skill levels were each allowed to play until they had lost 3 games and this resulted in 100 games played. D. Two players of equal skill level each played one game a day for 50 days and their skill level did not change from day to day. E. Two players of different skill levels competed by allowing one player to continue until a game was lost, then the other player to continue until a game was lost, and so on, until 100 games were played. Topic: interpretation of geometric mean 89. Let W represent the number of attempted experiments to get one experiment that is not successful. The random variable W has a geometric distribution with mean 4 and standard deviation 3.5. Which of the following is the best interpretation of the standard deviation? A. A single value randomly selected from the distribution of W will vary from 4 by 3.5 attempted experiments. B. A single value randomly selected from the distribution of W will vary from 3.5 by 4 attempted experiments. C. Values of W typically vary from 4 by about 3.5 attempted experi- ments, on average. D. Values of W typically vary from 3.5 by about 4 attempted experi- ments, on average. E. The standard deviation of a random sample of values selected from the distribution of W will be 3.5 attempted experiments. 90. According to a recent survey, 47 percent of the people living in a certain region carry a certain genetic trait. People from the region will be selected at random one at a time until someone is found who carries the genetic trait. Let the random variable G represent the number of people selected to find one person who carries the genetic trait. On average, how many people from the region will need to be selected to find one person who carries the genetic trait? A. 0.47 Β. 0.69 C. 1.55 D. 2.00 Ε. 2.13 91. The random variable W has a geometric distribution with p = 0.25. Approxi- mately how far do the values of W typically vary, on average, from the mean of the distribution? A. 1.73 B. 2.00 C. 3.00 D. 3.46 Ε. 4.00 92. Let S represent the number of randomly selected adults in a community surveyed to find someone with a certain genetic trait. The random variable S follows a geometric distribution with mean 4.66. Which of the following is a correct interpretation of the mean? A. A value randomly selected from the distribution of S is expected to be 4.66. B. In repeated sampling from the distribution of S, the average of the values will approach 4.66. C. For a sample of values randomly selected from the distribution of S, the average of the sample will be 4.66. D. The probability is 0.66 that a value randomly selected from the distribution of S will be close to the mean. E. For a sample of values randomly selected from the distribution of S, the average of the sample will vary from the population mean by no more than 4.66. Topic: central limit theorem 93. There were 5,317 previously owned homes sold in a western city in the year 2000 The distribution of the sales prices of these homes was strongly right- skewed, with a mean of $206,274 and a standard deviation of $37,881. If all possible simple random samples of size 100 are drawn from this population and the mean is computed for each of these samples, which of the following describes the sampling distribution of the sample mean? A. Approximately normal with mean $206, 274 and standard deviation $3,788 B. Approximately normal with mean $206, 274 and standard deviation $37,881 C. Approximately normal with mean $206, 274 and standard deviation $520 D. Strongly right-skewed with mean $206, 274 and standard deviation $3,788 E. Strongly right-skewed with mean $206, 274 and standard deviation $37,881 94. For which of the following conditions is it not appropriate to assume that the sampling distribution of the sample mean is approximately normal? A. A random sample of 8 taken from a normally distributed popula- tion B. A random sample of 50 taken from a normally distributed popula- tion C. A random sample of 10 taken from a population distribution that is skewed to the right D. A random sample of 75 taken from a population distribution that is skewed to the left E. A random sample of 100 taken from a population that is uniform 95. The distribution of age for players of a certain professional sport is strongly skewed to the right with mean 26.8 years and standard deviation 4.2 years. Consider a random sample of 4 players and a different random sample of 50 players from the population. Which of the following statements is true about the sampling distributions of the sample mean ages for samples of size 4 and samples of size 50 ? A. Both will be skewed to the right, and the mean for size 50 will be closer to 26.8 than the mean for size 4. B. Both will be skewed to the right, and the standard deviation for size 50 will be closer to 4.2 than the standard deviation for size 4. C. Both will be approximately normal, and the mean for size 50 will be closer to 26.8 than the mean for size 4. D. Only the sampling distribution for size 4 will be approximately normal, and the standard deviation for both will be 4.2. E. Only the sampling distribution for size 50 will be approximately normal, and the mean for both will be 26.8. 96. A manufacturer of cell phone batteries claims that the average number of recharge cycles for its batteries is 400. A consumer group will obtain a random sample of 100 of the manufacturer's batteries and will calculate the mean number of recharge cycles. Which of the following statements is justified by the central limit theorem? A. The distribution of the number of recharge cycles for the sample is approximately normal because the population mean of 400 is greater than 30 B. The distribution of the number of recharge cycles for the sample is approximately normal because the sample size of 100 is greater than 30 C. The distribution of the number of recharge cycles for the population is approximately normal because the sample size of 100 is greater than 30 D. The distribution of the sample means of the number of recharge cycles is approximately normal because the sample size of 100 is greater than 30 E. The distribution of the sample means of the number of recharge cycles is approximately normal because the population mean of 400 is greater than 30 . Topic: sampling distribution of sample proportion normality 97. City officials estimate that 46 percent of all city residents are in favor of building a new city park. A random sample of 150 city residents will be selected. Suppose that 51 percent of the sample are in favor of building a new city park. Which of the following is true about the sampling distribution of the sample proportion for samples of size 150 ? A. The distribution is not normal, and the mean is 0.46. B. The distribution is not normal, and the mean is 0.51. C. The distribution is not normal, and the mean is the average of 0.46 and 0.51. D. The distribution is approximately normal, and the mean is 0.46. E. The distribution is approximately normal, and the mean is 0.51. 98. A sample of size n will be selected from a population with population proportion p. Which of the following must be true for the sampling distribution of the sample proportion to be approximately normal? A. Both np and n(1 - p) are at least 10. B. n is greater than 30. C. p is greater than 0.5. D. The mean is equal to np. E. The variance is equal to np(1 – p). 99. A bag contains chips of which 27.5 percent are blue. A random sample of 5 chips will be selected one at a time and with replacement. What are the mean and standard deviation of the sampling distribution of the sample proportion of blue chips for samples of size 5 ? A. The mean is 5(0.275), and the standard deviation is √(5(0.275)(0.725)). B. The mean is 0.275, and the standard deviation is √(5(0.275) (0.725)). C. The mean is 0.275, and the standard deviation is √(0.275(0.725)/5) D. The mean is 27.5, and the standard deviation is √(5(27.5) (72.5)). E. The mean is 27.5, and the standard deviation is √(27.5(72.5)/5) 100. According to data from the United States Elections Project, only 36 percent of eligible voters voted in the 2014 elections. For random samples of size 40, which of the following best describes the sampling distribution of p̂, the sample proportion of people who voted in the 2014 elections? A. The sampling distribution is skewed to the left, with mean 0.36 and standard deviation 0.076. B. The sampling distribution is skewed to the right, with mean 0.64 and standard deviation 0.006. C. The sampling distribution is approximately normal, with mean 0.36 and standard deviation 0.076. D. The sampling distribution is approximately normal, with mean 0.36 and standard deviation 0.006. E. The sampling distribution is approximately normal, with mean 0.64 and standard deviation 0.076. Section II. Free Response Questions Instructions: Show all your work. Indicate clearly the methods you use, because you will be scored on the correctness of your methods as well as on the accuracy and completeness of your results and explanations. Topic: Probability Distribution (概率分布) 1. In the table below, the hurricane damage amounts have been replaced by the ranks 1,2, or 3. For each of the distance categories, the highest damage amount is assigned a rank of 1 and the lowest damage amount is assigned a rank of 3. Determine the missing ranks for the 10-to-20-miles distance category and calculate the average rank for each of the three regions. Place the values in the table below. ASSIGNED RANKS WITHIN DISTANCE CATEGORIES < 1 mile 1 to 2 miles 2 to 5 miles 5 to 10 miles 10 to 20 mil Gulf Coast 2 2 3 1 Forida 1 1 1 2 Lower Atlantic 3 3 2 3 c. Consider testing the following hypotheses. Ho: There is no difference in the distributions of hurricane damage amounts among the three regions. Ha: There is a difference in the distributions of hurricane damage amounts among the three regions. If there is no difference in the distribution of hurricane damage amounts among the three regions (Gulf Coast, Florida, and Lower Atlantic), the ex- pected value of the average rank for each of the three regions is 2. Therefore, the following test statistic can be used to evaluate the hypotheses above: Q = 5 [(RG - 2)^2 + (RF - 2)^2 + (RA - 2)^2] where RG is the average rank over the five distance categories for the Gulf Coast (and RF and RA are similarly defined for the Florida and Lower At- lantic coastal regions). Calculate the value of the test statistic using the average ranks you ob- tained in part (c). d. One thousand simulated values of this test statistic, Q, were calculated, assuming no difference in the distributions of hurricane damage amounts among the three coastal regions. The results are shown in the table below. These data are also shown in the frequency plot where the heights of the lines represent the frequency of occurrence of simulated values of Q. Frequency Table for Simulated Values of Q Q Frequency Cumulative Frequency 0.0 48 48 0.4 262 310 1.2 168 478 1.6 153 6.81 2.8 186 817 3.6 59 876 4.8 33 909 5.2 52 961 6.4 16 977 7.6 15 992 8.4 6 998 10.0 2 1000 FREQUENCY PLOT Frequency 262 250 200 168 153 150 100 50 48 186 59 52 33 16 15 6 2 2 0 0 1 2 3 4 5 6 7 8 9 10 Simulated Values of Q Simulated Valucs of 2. Show all your work. Indicate clearly the methods you use, because you will be scored on the correctness of your methods as well as on the accuracy and completeness of your results and explanations. Company F sells fabrics known as fat quarters, which are rectangles of fab- ric created by cutting a yard of fabric into four pieces. Occasionally the manufacturing process results in a fabric defect. Let the random variable X represent the number of defects on a fat quarter created by Company F. The following table shows the probability distribution of X. X 0 1 2 3 4 or more Probability 0.58 0.23 0.11 0.05 0.03 Y 0 1 2 Prob. 0.58 0.23 all 0.42 0.20 0.92 If a fat quarter has more than 2 defects, it cannot be sold and is discarded. Let the random variable Y represent the number of defects on a fat quarter that can be sold by Company F. E(Y) = 0x0.63 + 1x0.25 + 2x0.12 (a) Construct the probability distribution of the random the random table = 0.49 -Vav Stud (b) Determine the mean and standard deviation of Y. Show your work. Company G also sells fat quarters. The mean and standard deviation of the number of defects on a fat quarter that can be sold by Company G are 0.40 and 0.66, respectively. The fat quarters sell for $5.00 each, but are discounted by $1.50 for each defect found. (c) What are the mean and standard deviation of the selling price for the fat quarters sold by Company G? 0.58 : 0.23 : 0.992 0.58. 0.23. all 0.92 0.92 0.92 3. Show all your work. Indicate clearly the methods you use, because you will be scored on the correctness of your methods as well as on the accuracy and completeness of your results and explanations. To increase morale among employees, a company began a program in which one employee is randomly selected each week to receive a gift card. Each of the company's 200 employees is equally likely to be selected each week, and the same employee could be selected more than once. Each week's selection is independent from every other week. std(Y) = √(0.63 * (0 - 0.44)^2 + 0.25 * (1 - 0.44)^2 + 0.12 * (2 - 0.44)^2) ≈ 0.70 Selling Price = 5 - 1.5G E(Price) = E(5 - 1.5G) = 5 - 1.5E(G) Std(Price) = Std(5 - 1.5G) = |-1.5| Std(G) = 1.5 Std(G). E(a+bX)= a+b E(X) Std (a+bX) = |b| Std(X) Std(aX+bY+c) = √(a^2 Std(X)^2 + b^2 Std(Y)^2) (a) Consider the probability that a particular employee receives at least one gift card in a 52 -week year. (i) Define the random variable of interest and state how the random variable is distributed. (ii) Determine the probability that a particular employee receives at least one gift card in a 52 -week year. Show your work. (b) Calculate and interpret the expected value for the number of gift cards a particular employee will receive in a 52-week year. Show your work. (c) Suppose that Agatha, an employee at the company, never receives a gift card for an entire 52 -week year. Based on her experience, does Agatha have a strong argument that the selection process was not truly random? Explain your answer. Topic: Confidence Intervals & Hypothesis Testing (置信区间与假设 检验) 4. Systolic blood pressure is the amount of pressure that blood exerts on blood vessels while the heart is beating. The mean systolic blood pressure for people in the United States is reported to be 122 millimeters of mercury (mmHg) with a standard deviation of 15mmHg. The wellness department of a large corporation is investigating whether the mean systolic blood pressure of its employees is greater than the reported national mean. A random sample of 100 employees will be selected, the systolic blood pressure of each employee in the sample will be measured, and the sample mean will be calculated. Let μ represent the mean systolic blood pressure of all employees at the corporation. Consider the following hypotheses. Ho : μ = 122 Ha: μ > 122 a. Describe a Type II error in the context of the hypothesis test. b. Assume that σ, the standard deviation of the systolic blood pressure of all employees at the corporation, is 15mmHg. If μ = 122, the sampling distribution of x̄ for samples of size 100 is approximately normal with a mean of 122mmHg and a standard deviation of 1.5mmHg. What values of the sample mean x̄ would represent sufficient evidence to reject the null hypothesis at the significance level of α = 0.05 ? The actual mean systolic blood pressure of all employees at the corporation is 125mmHg, not the hypothesized value of 122mmHg, and the standard deviation is 15mmHg. c. Using the actual mean of 125mmHg and the results from part (b), deter- mine the probability that the null hypothesis will be rejected. d. What statistical term is used for the probability found in part (c)? e. Suppose the size of the sample of employees to be selected is greater than 100. Would the probability of rejecting the null hypothesis be greater than, less than, or equal to the probability calculated in part (c) ? Explain your reasoning 5. (a) Of the two histograms shown, I and II, which is more likely to be the distribution of completion times for the students in Group R? Justify your answer. (b) Describe the shape of a histogram created from the data of the two groups of students combined. (c) Consider the population of all students in honors biology classes in the high school's state who are given the task of using the spreadsheet program to investigate the topic in genetics. The distribution of the completion times has a shape similar to the combined histogram of students at the high school, with mean 70 minutes and standard deviation 26.5 minutes. For random samples of 50 students taken from the population, describe the sampling distribution of the sample mean completion time. 6. Show all your work. Indicate clearly the methods you use, because you will be scored on the correctness of your methods as well as on the accuracy and completeness of your results and explanations. A polling agency is investigating the voter support for a ballot measure in an upcoming city election. The agency will select a random sample of 500 voters from one region, Region A, of the city. Assume that the population proportion of voters who would support the ballot measure in Region A is 0.47. (a) What is the probability that the proportion of voters in the sample of Region A who support the ballot measure is greater than 0.50 ? The polling agency will take another sample from a different region, Region B, of the city. The agency plans to select a random sample of 400 voters. Assume that the population proportion of voters who would support the ballot measure in Region B is 0.51. (b) Describe the sampling distribution of the difference in sample proportions (Region B minus Region A). (c) What is the probability that the two sample proportions will differ by more than 0.05 ? 7. Directions: Show all your work. Indicate clearly the methods you use, be- cause you will be scored on the correctness of your methods as well as on the accuracy and completeness of your results and explanations. A large company produces an equal number of brand-name lightbulbs and generic lightbulbs. The director of quality control sets guidelines that produc- tion will be stopped if there is evidence that the proportion of all lightbulbs that are defective is greater than 0.10. The director also believes that the proportion of brand-name lightbulbs that are defective is not equal to the proportion of generic lightbulbs that are defective. Therefore, the director wants to estimate the average of the two proportions. To estimate the proportion of brand-name lightbulbs that are defective, a simple random sample of 400 brandname lightbulbs is taken and 44 are found to be defective. Let X represent the number of brand-name lightbulbs that are defective in a sample of 400, and let Px represent the proportion of all brand- name lightbulbs that are defective. It is reasonable to assume that X is a binomial random variable. (a) One condition for obtaining an interval estimate for Px is that the dis- tribution of pPx is approximately normal. Is it reasonable to assume that the condition is met? Justify your answer. (b) The standard error of Px is approximately 0.0156. Show how the value of the standard error is calculated. (c) How many standard errors is the observed value of Px from 0.10 ? To estimate the proportion of generic lightbulbs that are defective, a simple random sample of 400 generic lightbulbs is taken and 104 are found to be defective. Let Y represent the number of generic lightbulbs that are defec- tive in a sample of 400. It is reasonable to assume that Y is a binomial random variable and the distribution of Py is approximately normal, with an approximate standard error of 0.0219. It is also reasonable to assume that X and Y are independent. The parameter of interest for the manager of quality control is D, the av- erage proportion of defective lightbulbs for the brand-name and the generic lightbulbs. D is defined as D = (Px+Py)/2. (d) Consider D, the point estimate of D. (i) Calculate D using data from the sample of brand-name lightbulbs and the sample of generic lightbulbs. (ii) Calculate the standard error of D, denoted as sD. Consider the following hypotheses. H0: The average proportion of all lightbulbs that are defective is 0.10.(D = 0.10). Ha: The average proportion of all lightbulbs that are defective is greater than 0.10.(D > 0.10) A reasonable test statistic for the hypotheses is W, defined as W = (D̂ - 0.10) / sD. e) Calculate W using your answer to part (d). (f) Chebyshev's inequality states that the proportion of any distribution that lies within k standard errors of the mean is at least 1 - 1/k^2. Use Chebyshev's inequality and the value of W to decide whether there is statistical evidence, at the significance level of α = 0.05, that D, the average proportion of all lightbulbs that are defective, is greater than 0.10. Answer Key (Multiple Choice) 1. C 21. B 41. A 61. A 81. A 2. B 22. B 42. A 62. A 82. A 3. E 23. D 43. A 63. A 83. A 4. C 24. A 44. A 64. A 84. A 5. D 25. B 45. A 65. A 85. A 6. D 26. B 46. A 66. A 86. A 7. B 27. C 47. A 67. A 87. A 8. C 28. E 48. A 68. A 88. A 9. D 29. A 49. A 69. A 89. A 10. D 30. C 50. A 70. A 90. A 11. B 31. B 51. A 71. A 91. A 12. D 32. E 52. A 72. A 92. A 13. A 33. D 53. A 73. A 93. A 14. A 34. B 54. A 74. A 94. A 15. A 35. D 55. A 75. A 95. A 16. D 36. E 56. A 76. A 96. A 17. B 37. B 57. A 77. A 97. A 18. B 38. A 58. A 78. A 98. A 19. C 39. B 59. A 79. A 99. A 20. B 40. E 60. A 80. A 100. A